
What If We Paid Landowners to Store Water?
Using the Renewable Energy Model to Finance Watershed Resilience
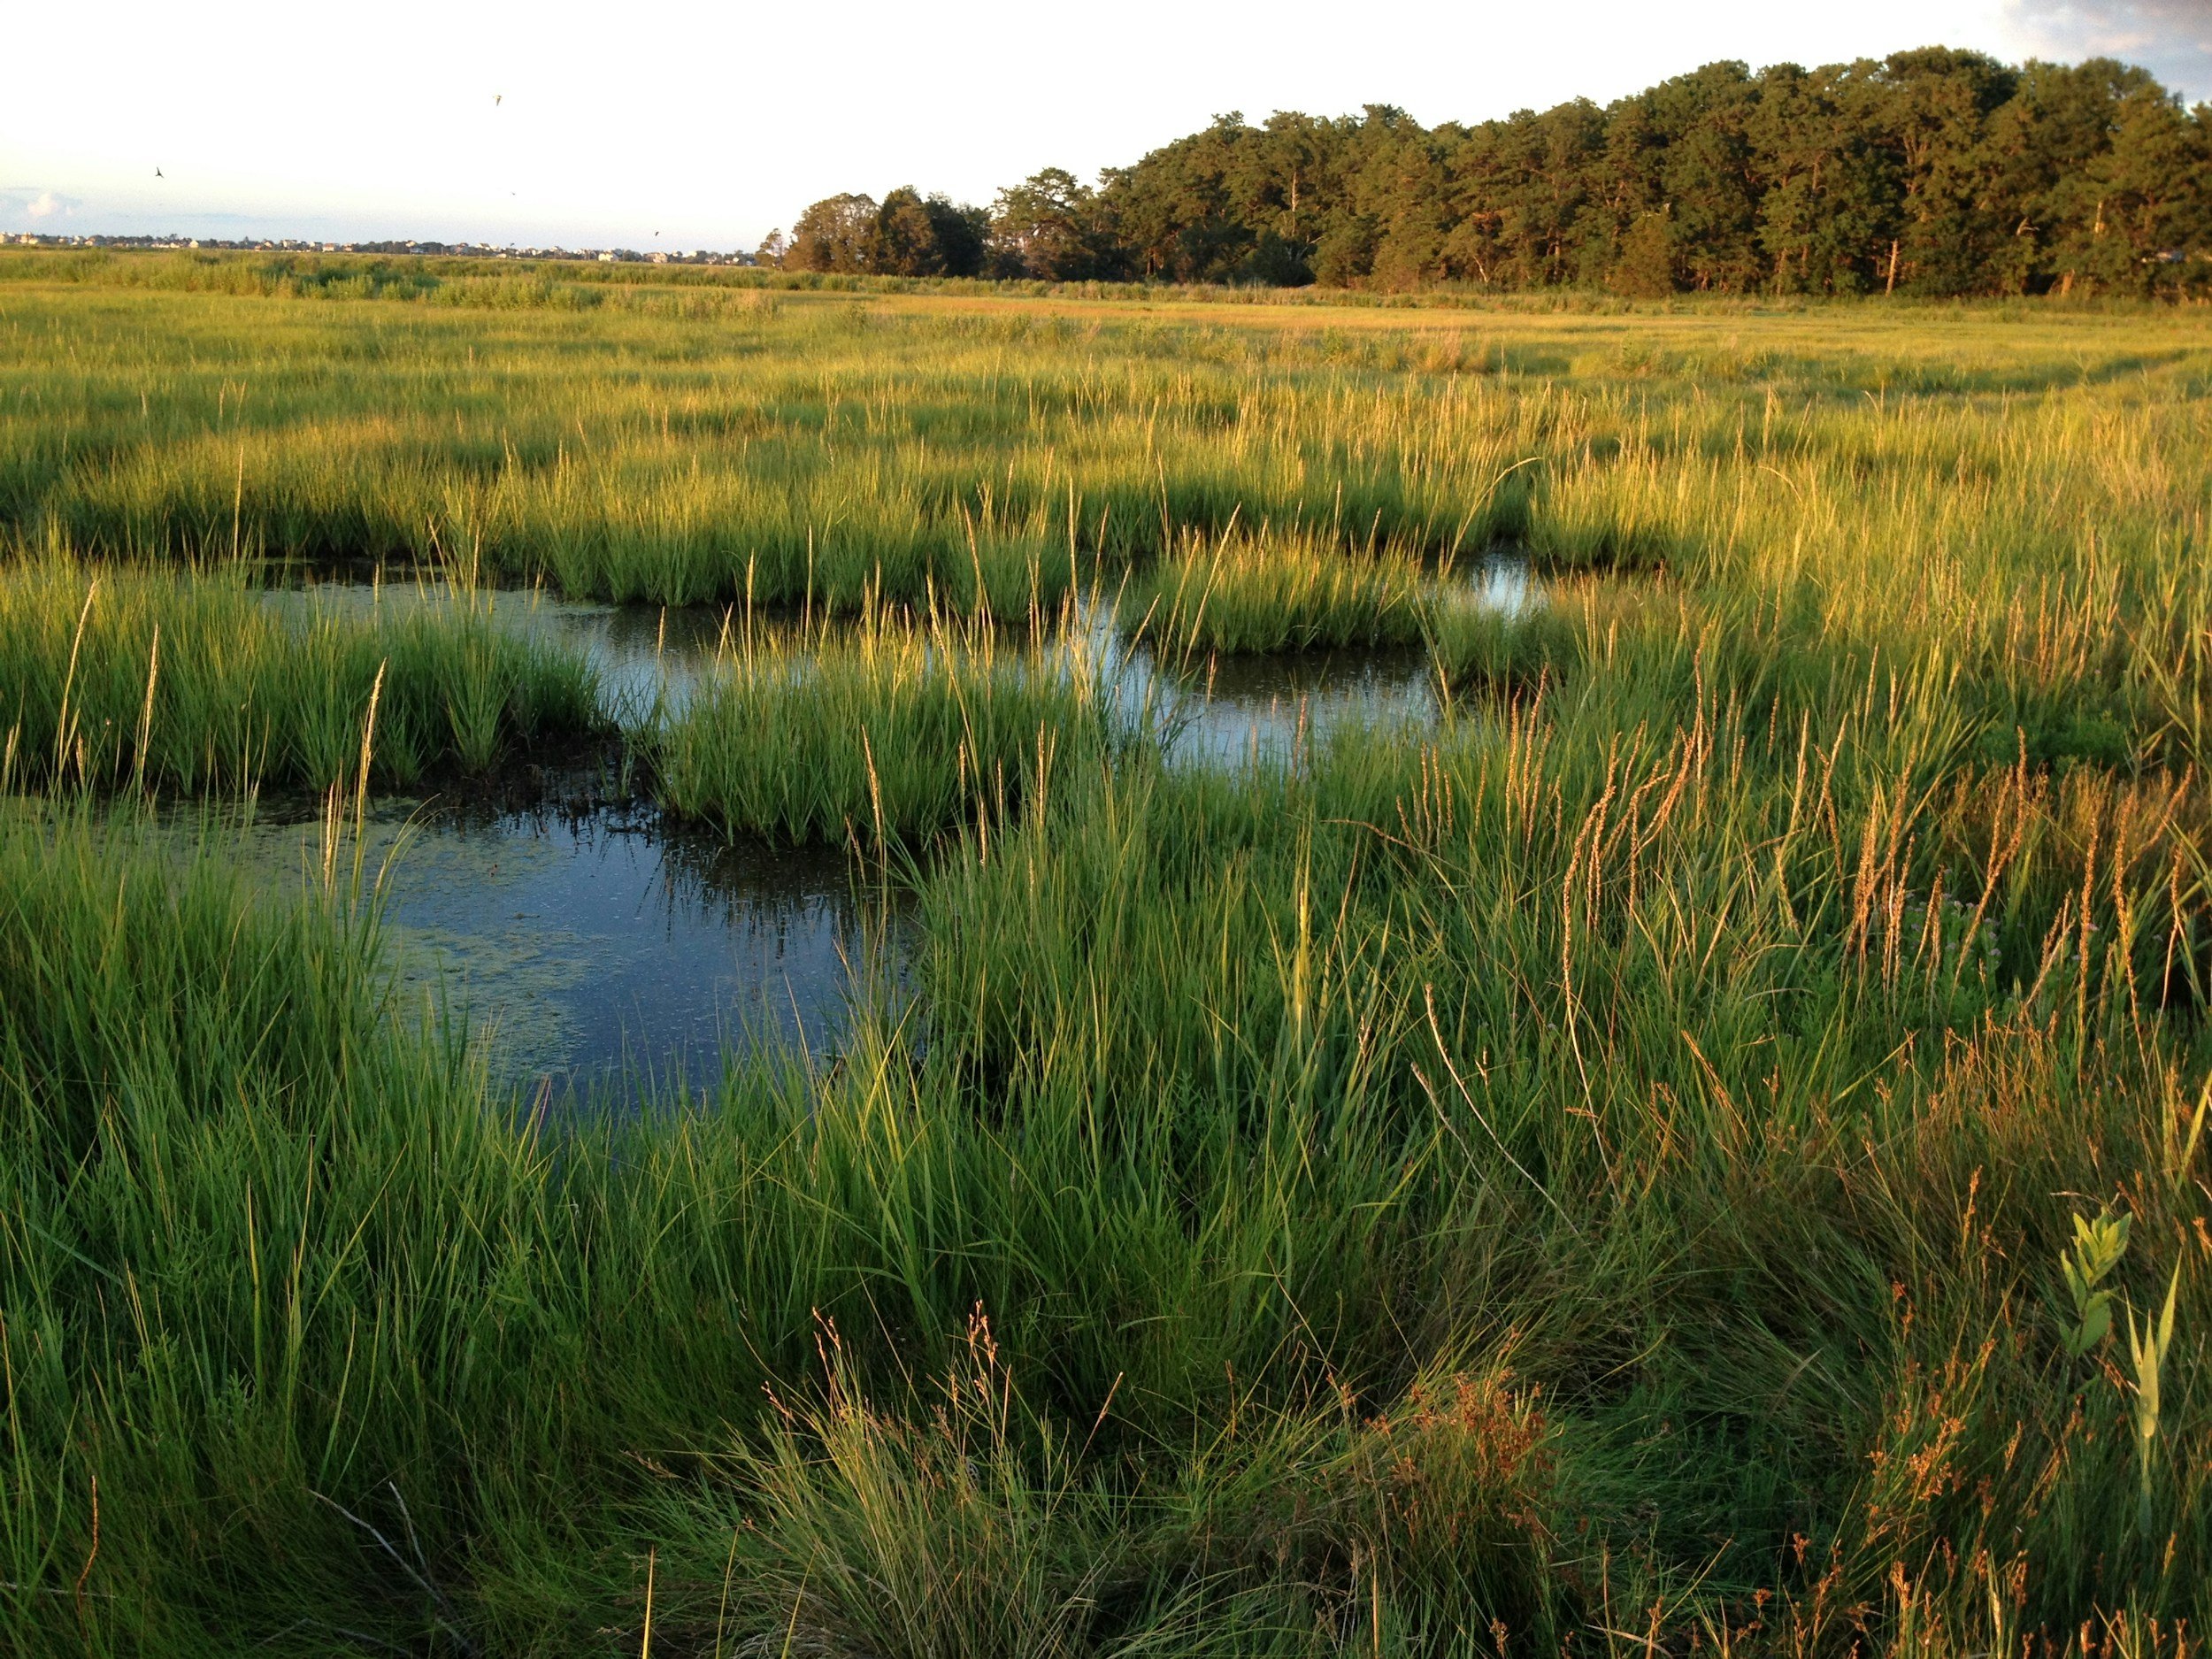
Wetlands provide a multitude of benefits including water storage, water filtration, groundwater infiltration, and biodiversity.
I recently learned more about how railroad rights-of-way work. Railroad companies assembled long, continuous corridors by purchasing land or acquiring permanent easements across thousands of individual properties. Landowners were compensated for allowing privately developed infrastructure with broad public and economic benefits to cross their land.
That basic concept—paying landowners to host infrastructure—has existed for centuries. If we can assemble corridors for railroads, pipelines, transmission lines, fiber-optic cables or even pay landowners to host wind turbines and solar panels, we can use a similar structure for a different kind of infrastructure: water.
In my last article, I wrote about how we should take lessons from the renewable energy market architecture and apply it to watershed resilience and nature. The history of renewable energy scaling in the US informs how we can create demand, enable procurement, incentivize competitive development of projects, and bring in diverse capital to scale investment.
This post focuses on why we need to develop natural water resources as infrastructure—what’s the need for all of this enabling architecture? And if the need is so great, how could a long-term offtake for water resources work?
Why we need to treat water resources as infrastructure
In the contiguous United States, we have lost approximately 53% of the wetlands that existed in the late 1700s (historically 220 million acres in the lower 48 states). The causes of loss: filling in wetlands for urban development or agriculture, drain tiling fields for agriculture, and rerouting of water to managed stormwater ponds to keep nature “tidy” and out of our development plans. The latest proposed revisions to the WOTUS definition could further narrow the wetlands and waters protected under federal law—continuing a broader retreat from federal wetland protection following the Supreme Court’s 2023 decision in Sackett v. EPA.
A nationwide USGS study evaluated 2,888 rivers and streams and found that we have altered 86% of the minimum or maximum flows with dams, diversions, agricultural drainage, groundwater withdrawals, and other forms of engineered management. Across much of the country, the conversion of native vegetation to cropland and urban development has also changed infiltration, runoff and evapotranspiration. Lastly, we pump groundwater and divert snowmelt away from wetlands, streams, and rivers to faraway basins to irrigate crops or water lawns in big cities. The disruption to our natural water infrastructure has been nearly comprehensive.
And we see the effects of this disruption.
Water scarcity
This risk is not theoretical. Already 11% of water utilities surveyed by the American Water Works Association experience frequent or chronic stress on their local water supplies, while another third reported that even a modest increase in demand or decrease in supply could make it difficult to provide drinking water. The Colorado River’s two largest reservoirs, Lake Mead and Lake Powell, reached record-low elevations in August 2026, while their combined storage fell to its lowest level since before Lake Powell began filling in 1963. Across parts of the West, shortages are forcing reductions in irrigation deliveries and curtailment of junior water rights. Nearly 30 million Americans—approximately 8% of the population of the contiguous United States—live in areas experiencing chronic high or severe surface-water limitations.
We are drawing down groundwater like a bank account without enough deposits: the Ogallala Aquifer and major groundwater basins across the West are being pumped faster than natural recharge can replace what we take.
This isn’t a distant problem. Joliet, Illinois, is spending billions to transition away from the deep sandstone aquifer that has supplied the region for generations because continued groundwater withdrawals are not considered sustainable. The city plans to shift to Lake Michigan water by 2030—a striking example of what happens when a community’s demand begins to exceed the capacity of its underlying water supply.
The World Resource Institute’s Aqueduct Water Tool maps water risk around the world, including water scarcity, riverine flood risk, groundwater depletion, etc. Much of the US is at risk for one or more of these water-related challenges.
Flooding
In the Midwest and Eastern US, we are getting more intense, short-duration storms that exceed historic rainfall records and cause catastrophic flooding. Flooding imposes an estimated $179.8 billion to $496 billion in total economic costs each year in the United States, including direct physical damage, indirect costs, and infrastructure impacts. Since 1965, floods have generally become larger across much of the Northeast and Midwest and more frequent across the Northeast, Pacific Northwest, and northern Great Plains.
Our federal flood insurance system is already under enormous financial strain. FEMA's National Flood Insurance Program has borrowed roughly $38.5 billion from the U.S. Treasury since 2005 to pay claims. And yet the risk doesn't stop at the line on a FEMA flood map. Nearly 30 percent of NFIP flood claims over the past decade came from properties outside FEMA's designated high-risk flood areas.
That creates a much larger economic exposure than the regulatory floodplain suggests. Millions of dollars of homes, businesses and infrastructure can sit outside the technical floodplain—and therefore outside many of the insurance, lending and regulatory signals associated with flood risk—while still facing meaningful exposure to flooding. Research increasingly suggests that this risk may not be fully reflected in property values until buyers are actually given better information about it.
In other words, flood resilience isn't only about protecting the properties we already know are in the floodplain. It's also about protecting the enormous amount of real estate value sitting just outside those lines whose owners may not yet realize how much risk they carry.
Water Quality
Nearly half (47%) of U.S. river and stream miles are in poor biological condition. EPA also found 42% in poor condition for phosphorus and 44% for nitrogen. Iowa is ground zero for water quality due to high nitrates. In a 2024 study of farmers using private wells in eight eastern Iowa counties, 32% of participants had drinking-water nitrate concentrations at or above the federal maximum contaminant level. Epidemiological studies have also associated long-term nitrate exposure in drinking water with elevated risks of certain cancers and other adverse health effects, including at concentrations below the federal limit.
Every year, a dead zone of approximately 5,223 square miles—roughly the size of Connecticut—emerges in the Gulf of Mexico, disrupting local fisheries and reducing usable habitat for marine life. Poor water quality is also caused by hazardous contaminants like PFAS and forever chemicals. EPA adopted the first federal drinking-water limits for six PFAS in 2024, although the agency has since proposed rescinding several of those standards and delaying implementation of the remaining limits.
Big Problems, but We Know How to Fix It
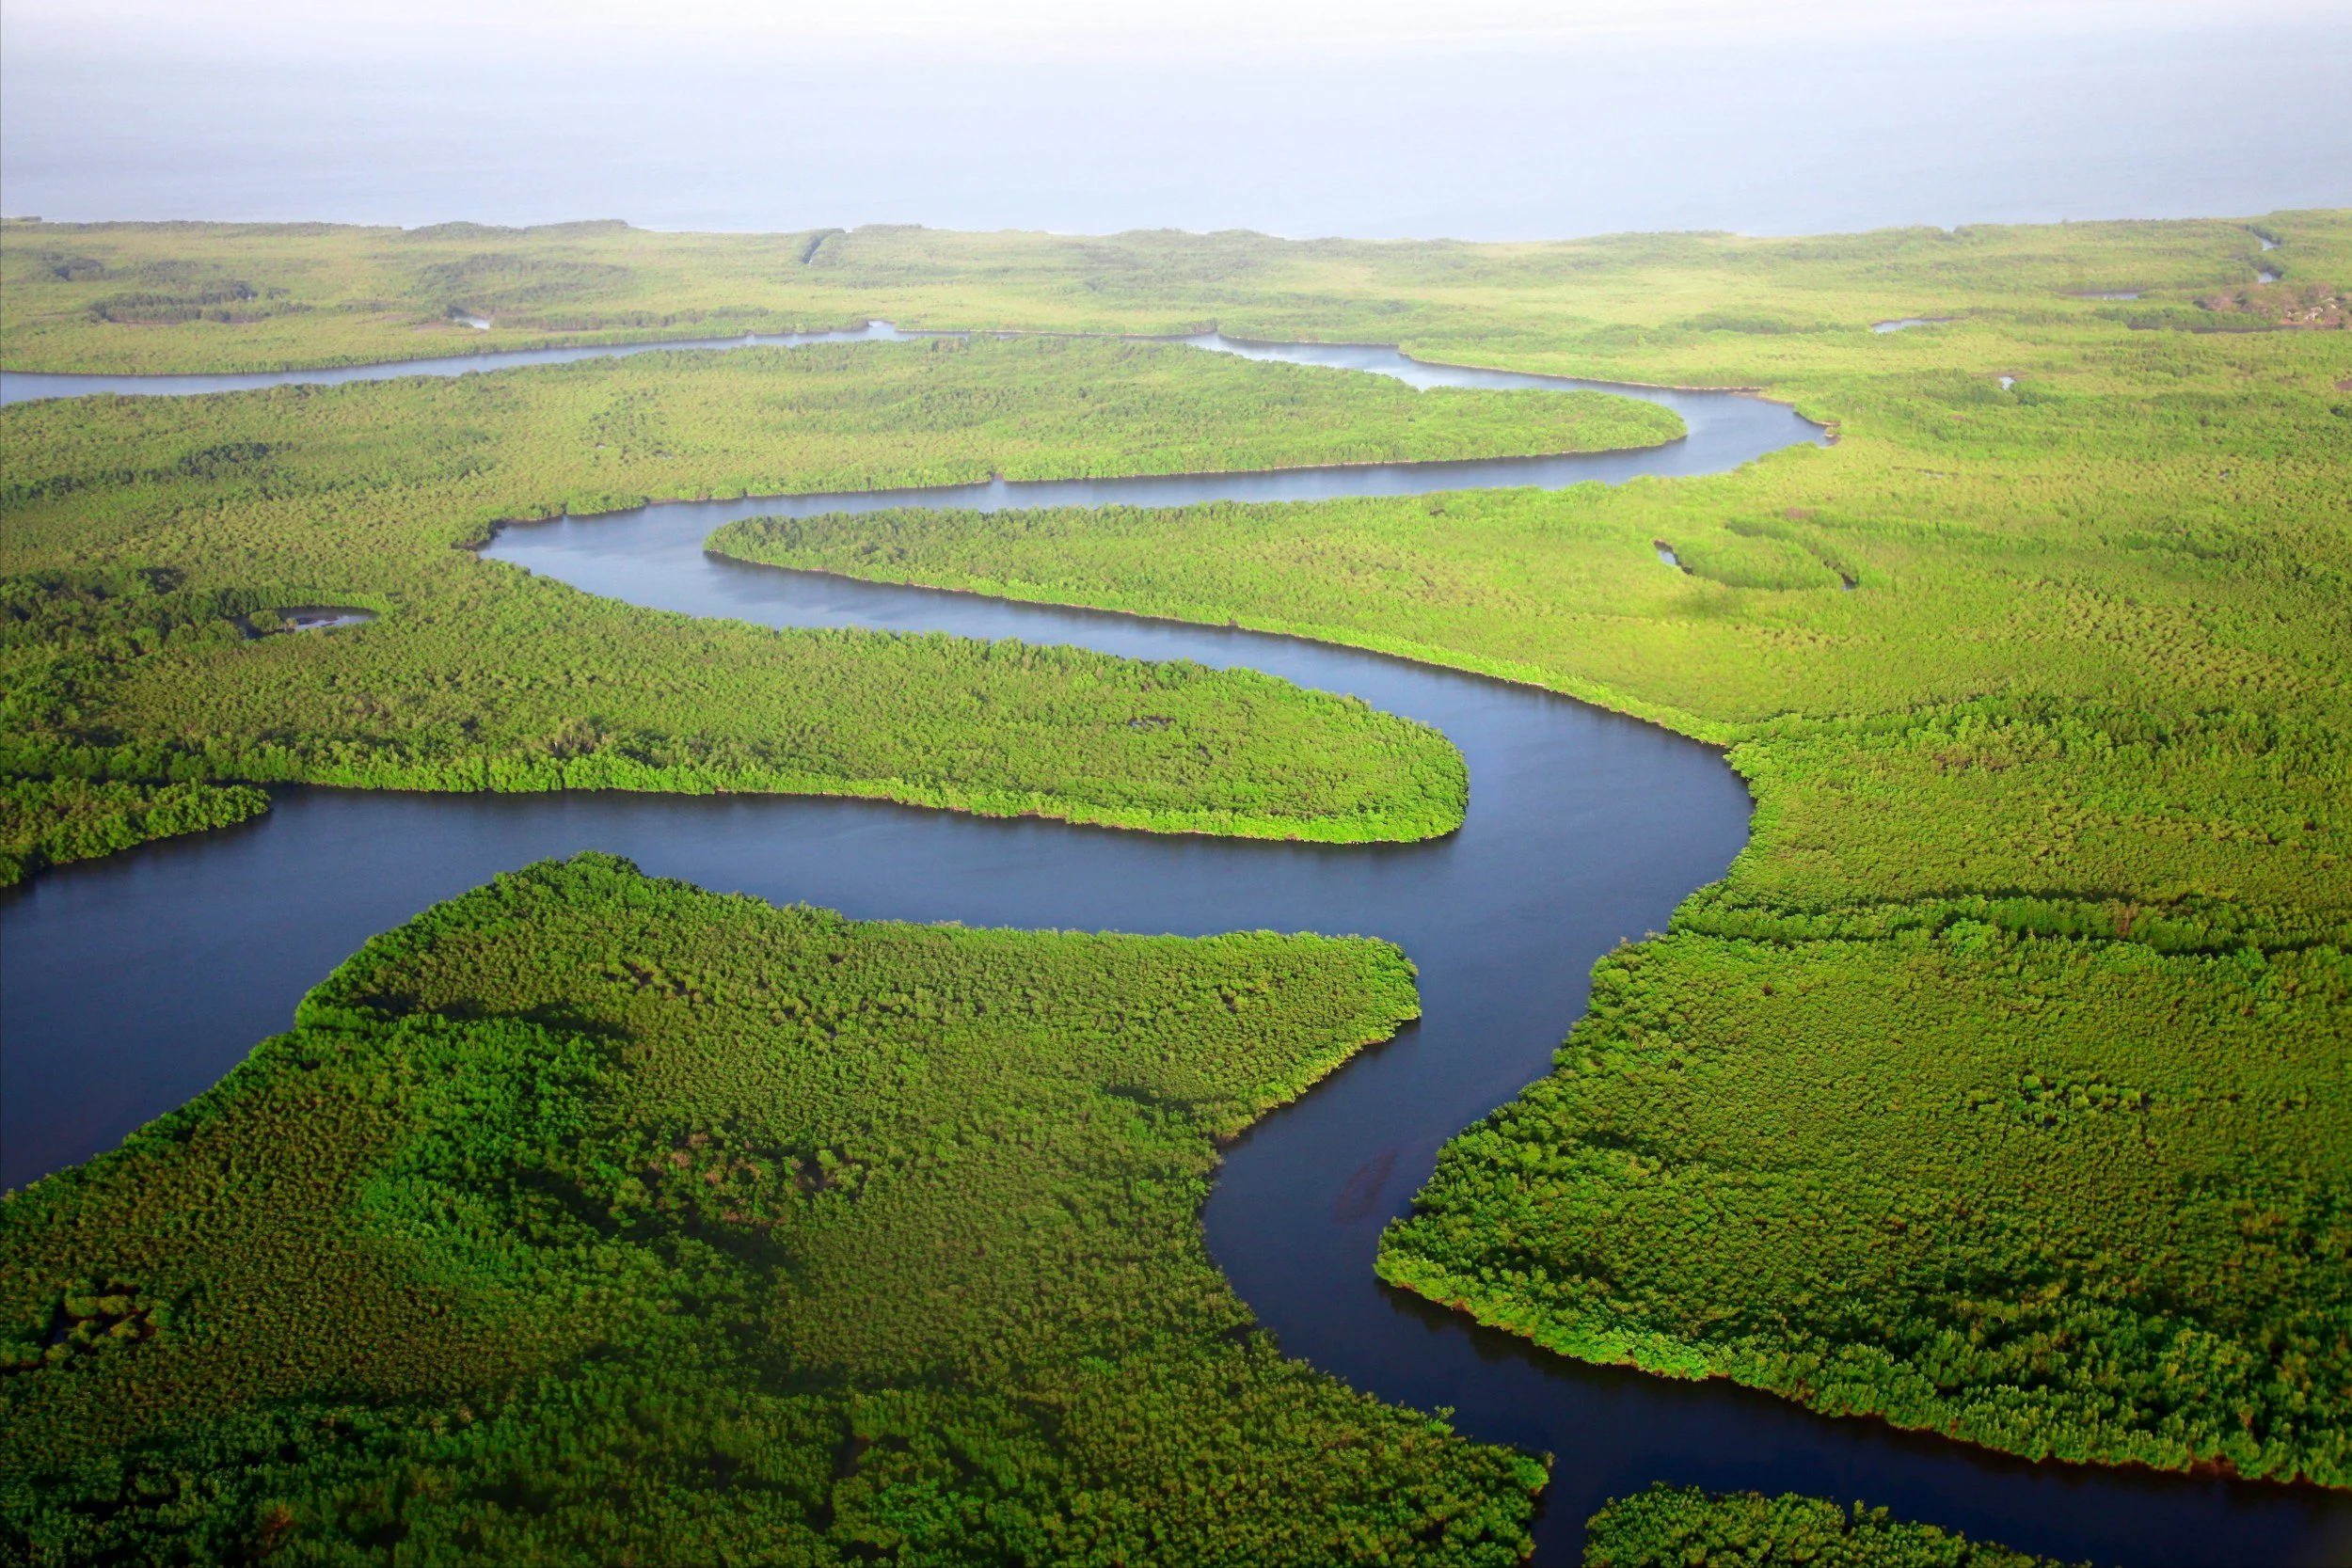
Water moves across the landscape in long, linear shapes, similar to other linear infrastructure- railroads, transmission lines, and fiber optic. We need to manage it accordingly.
These problems are daunting, but we have addressed and managed challenges of similar magnitude in the past. Remember the Cuyahoga River catching fire? The 1969 fire became a national symbol of water pollution and helped build momentum for the sweeping 1972 amendments now known as the Clean Water Act. This regulation came alongside a growing environmental movement that increasingly connected pollution with ecological and human health. New policies are chipping away at those protections rather than shoring them up. We have forgotten what happens when we don’t protect our water.
Clean, stable water supplies are critical to our economy. Without water, we cannot live safely, grow crops, or produce goods. We lose recreational tourism dollars and rural economies. We experience catastrophic personal losses and business risk from fire and flood.
We are here again, in need of significant action to protect water resources, stabilize drinking water supplies and groundwater, and ensure that we invest in a more resilient future.
The goal is not to avoid all potential natural variation in weather, climate, and natural disasters. Some flood, fire, and drought is inevitable. But we need to invest in water resources so that these events are moderated in severity. We need to invest in resilience.
And we know what to do. It’s truly not rocket science, thankfully. It’s going back to the oldest "technology” there is—nature. Restoring wetlands can raise local groundwater tables, slow runoff and provide floodwater storage, depending on their location and hydrology—a one-acre wetland can typically store approximately three acre-feet, or one million gallons, of water. Reconnecting floodways and floodplains gives water a place to go when rivers naturally rise during peak rain events. Enabling the return of beaver and beaver-dammed riparian corridors can keep surrounding vegetation wetter and create fire-resistant refuges during wildfire. Removing drainage ditches and drain tiles in certain areas can allow water to spread and infiltrate across the landscape—rather than pumping it off as fast as possible—and causing a downstream surge of water to a city. Agricultural practices such as prairie filter strips, agroforestry buffers and saturated buffers can intercept runoff or tile drainage, reduce nutrient losses and improve downstream water quality.
How Do We Pay for It?
But how do we pay for it? Let’s go back to the railroads. The government heavily subsidized the construction of the railroads, developed by private companies. This program enabled the establishment of cities on opposite ends of the country, the shipping of goods and crops, and recreational tourism by rail. Railroads obviously had many negative effects as well, including the displacement of indigenous peoples and harm to natural resources, and those kind of impacts need to be taken into account in the design of any new infrastructure. But the government recognized that building a functional, distributed, rail system was critical infrastructure for the growth of the US economy. In modern times, we’ve been utilizing this framework for renewables. Now we need to do something similar with water.
There are two things that would make this actionable, today.
1. Regional Watershed Governance
The first is a regional governance and funding entity operating at the watershed scale. Water does not follow municipal or county boundaries. Rivers and floodplains move across counties, states, and countries in long, linear fashion. As a result, the existing political structures are not always well-situated to solve water related challenges. They are required to invest within their boundaries—not upstream, even if that’s where the problem needs to be solved. A regional district that works across political subdivisions can address this disconnect.
There are examples of this structure already—often called “Metropolitan Sewerage Districts” or “Water Reclamation Districts”. I wrote extensively about MMSD in the past and why their structure is so beneficial. Similar models could be used in predominantly rural areas to aggregate funds and invest in the most critical infrastructure across larger watersheds. Regional watershed districts could collect a service fee from everyone in the watershed boundary which could be used to fund stewardship and establishment of this infrastructure. Spread across all members of the watershed, it could be managed as a relatively small cost to all watershed residents, with major water users or corporate landowners potentially charged a higher fee. This is a necessary governance change to enable effective management and funding of watershed resources. Small annual fees can accrue to a meaningful amount of funding to make investments in resilience over time. There are no quick fixes to these challenges—resilience will likely built over decades of investment, just like the electric grid or nationwide network of railroads. We need to design our funding and financing strategy accordingly.
2. Design Simple Project Payment Structures
The second is designing a simple and repeatable project payment structure. How can we incentivize landowners to host this infrastructure on their property, just like they are willing to host solar panels, batteries, fiber optic lines, pipelines, transmission lines or railroads? Companies paid them to do so, and then companies get paid for delivering reliable internet, electricity, natural gas or rail service. We need to mimic these standard structures for nature. Here’s an example of how it could work:
Company identifies that Landowner has potentially restorable wetlands and streams with disconnected floodplains on the property.
The wetlands aren’t currently holding water because of drain tiles and the streams have eroded banks—disconnected from the floodplain or are channelized into drainage ditches.
Company A quantifies the cost to restore these resources, models the added water storage capacity, and the economic impact to the Landowner. Maybe the Landowner will lose 100 tillable acres from crop production by allowing these areas to store water in an average year, and 150 tillable acres in a wet year.
Landowner could be paid a flat rate for a permanent easement for these resources for the permanent loss of the economic potential of crop production (maybe a “resilience capacity easement”). Compliance with the easement (i.e., leaving wetlands and floodways in place) could be monitored annually through a combination of remote sensing, hydrologic data and periodic field inspection. Landowner could also be paid an additional “parametric storm-event payment” every time a certain measured rainfall event occurs and the watershed communities get the benefit of the added storage capacity from Landowner’s participation. The parametric payment is triggered by a locally defined rainfall threshold, regardless of how full a creek was, just like parametric insurance. This results in quick payments, non-subjective payment events, and easier implementation.
The permanent easement payment borrows from the traditional infrastructure right-of-way model. But water infrastructure could add another layer: a parametric payment triggered when a major rainfall event occurs and the restored landscape provides the agreed upon flood-storage capacity.
The payment recognizes the increased value the project provides to downstream communities during major storm events and may also compensate the landowner for additional inundation of the working landscape. The funds to pay the landowner come from the regional watershed authority’s water resilience fee. Over time, as the regional watershed authority collects the fees, it can deploy these funds into projects, holding some funding in reserve for storm event parametric payments during wet years. Where authorized by state law, a dedicated resilience fee could provide a predictable revenue stream against which a regional authority could borrow or enter into long-term project agreements, because the authority knows there will be a cash flow to pay back the loan, enabling the watershed district to potentially frontload investments to increase resilience ahead of the cash flows.
The water resilience fees function the same way electricity bills do for utilities. Every month on the city or county utility bill for water, a line item ($2.00, for example) is added for water resilience. These small incremental fees distributed across our entire population are how we invest in new infrastructure that we collectively decide is necessary over time. The guaranteed revenue for the regional watershed district enables the district to sign offtake agreements with companies developing projects, just like utilities were able to sign offtake agreements with renewable energy project developers. And the offtake agreements from the utilities to project developers allow them to invest in the landowner engagement, signing landowner agreements, quantifying storage capacity and restoration costs, and establishing the infrastructure—just like renewable project developers signed landowner agreements for solar or wind projects.
These components—easements, utility fees, revenue-backed financing, contract structures, procurement frameworks, and financing tools already exist. We just need to put the pieces together to create a scalable market for natural water infrastructure.
References
U.S. Environmental Protection Agency. “Threats to Wetlands.” EPA 843-F-01-002d. Reports that more than 220 million wetland acres existed in the lower 48 states and that more than half have been lost. EPA wetlands fact sheet
Carlisle, D.M., Wolock, D.M., and Meador, M.R. 2011. “Alteration of Streamflow Magnitudes and Potential Ecological Consequences: A Multiregional Assessment.” Frontiers in Ecology and the Environment 9(5): 264–270. The study found altered minimum or maximum flows at 86% of 2,888 assessed streams. USGS publication record
U.S. Government Accountability Office. 2014. Freshwater: Supply Concerns Continue, and Uncertainties Complicate Planning. GAO-14-430. GAO report
U.S. Bureau of Reclamation. 2026. “Future Colorado River Operations—Decision Documents.” Reports record-low Lake Mead and Lake Powell elevations in August 2026 and combined storage below any level since before Lake Powell began filling. Bureau of Reclamation
U.S. Environmental Protection Agency. “Climate Change Indicators: River Flooding.” Documents regional changes in flood magnitude and frequency since 1965. EPA river-flooding indicator
U.S. Global Change Research Program. 2023. Fifth National Climate Assessment, Chapter 24: Midwest. Discusses observed and projected increases in extreme precipitation and flood risk in the Midwest. National Climate Assessment Midwest chapter
U.S. Congress Joint Economic Committee Democratic Staff. 2024. Flooding Costs the U.S. Between $179.8 and $496.0 Billion Each Year. JEC report
National Integrated Drought Information System. “Historical Data and Conditions.” Reports that 54.8% of the United States was in drought in September 2012, the highest share in the U.S. Drought Monitor record beginning in 2000. Drought.gov
Skalaban, T., et al. 2024. “Nitrate Exposure from Drinking Water and Dietary Sources Among Iowa Farmers Using Private Wells.” Science of the Total Environment 918: 170922. USGS publication record
National Centers for Coastal Ocean Science. 2026. “NOAA Forecasts an Above-Average Summer Dead Zone.” Reports the 2026 forecast of 7,027 square miles and a 39-year measured average of 5,223 square miles. NOAA dead-zone summary
U.S. Environmental Protection Agency. “Final PFAS National Primary Drinking Water Regulation.” Describes the 2024 federal drinking-water limits and EPA’s proposed 2026 revisions. EPA PFAS regulation
U.S. Environmental Protection Agency. 2006. Wetlands: Protecting Life and Property from Flooding. Provides the rule-of-thumb estimate that a one-acre wetland can typically store approximately three acre-feet, or one million gallons, of water. EPA wetland flood-storage fact sheet
Fairfax, E., and Whittle, A. 2020. “Smokey the Beaver: Beaver-Dammed Riparian Corridors Stay Green During Wildfire Throughout the Western United States.” Ecological Applications 30(8): e02225. Peer-reviewed article
Zhou, X., et al. 2014. “Nutrient Removal by Prairie Filter Strips in Agricultural Landscapes.” Journal of Soil and Water Conservation 69(1): 54–64. USDA Agricultural Research Service summary
USDA Natural Resources Conservation Service. 2026. Conservation Practice Standard: Saturated Buffer, Code 604. Describes saturated buffers as systems designed to reduce nitrate loading from subsurface drainage through plant uptake and denitrification. NRCS standard
USDA Natural Resources Conservation Service. 2013. The Value of Soil Health. Provides a location-specific estimate of 16,500 additional gallons of plant-available water per acre for each percentage-point increase in soil organic matter. NRCS South Dakota fact sheet
U.S. Senate Historical Office. “Pacific Railway Act of 1862.” Describes the federal bonds and land grants used to support construction of the transcontinental railroad. U.S. Senate history
Federal Energy Regulatory Commission. 2026. “Understanding Wholesale Capacity Markets.” Explains capacity payments for resources that commit to remain available when the system needs them, including energy-storage resources. FERC capacity-market overview
U.S. Environmental Protection Agency and U.S. Department of the Army. 2026. “Updated Definition of Waters of the United States.” Describes the pending supplemental proposed rulemaking and its regulatory alternatives. EPA WOTUS rulemaking
U.S. Geological Survey. 2025. The National Integrated Water Availability Assessment, Water Years 2010–20. The assessment found that nearly 30 million Americans live in areas where available surface-water supplies are limited relative to water use. USGS National Water Availability Assessment
American Water Works Association. 2026. “Water Utility Leaders Contend with Forecasting for a Moving Target.” Based on 2,171 survey responses collected in late 2025; 11% of participating utilities reported frequent or chronic water-supply stress, while another third were vulnerable to modest changes in supply or demand. AWWA survey summary
U.S. Environmental Protection Agency, National Water Quality Inventory: Report to Congress (2024), EPA 841-R-23-001. EPA report
Stets, E.G., et al. 2025. “Local Water Use and Climate Drive Water Stress over the Conterminous United States with Substantial Impacts to Fish Species of Conservation Concern.” U.S. Geological Survey. USGS publication summary